
DevOps is a methodology/culture/approach to the development and deployment of software in the modern world. Analytics is the study and practice of extracting useful information out of data. So, no overlap there at all then; the two worlds are like chalk and cheese. Except, hang on, we could start applying analytics to the meta-data that DevOps produces to improve the development and deployment of the software. In truth, the worlds of DevOps and Analytics go together like politicians and corruption.
Just to recap, meta-data is data about data and is as old as the hills. An example in DevOps would be the data that describes the code development rather than the code itself. So, who changed the code base, when, and what changes did they make? Who rolled that change back and why?
On the operational side the meta-data is the data that describes the operational systems and all of the changes that are made to them, by whom, when and so on. What was the exact state of the operational environment at 9:37:06AM 23/3/2018? How long was it in that state before it changed? Who changed it and how and why? Clearly the application and system logs are an essential source of raw information here and they represent some of the meta-data we use.
Just how meta are we talking?
Before anyone else tells me, I am aware that DevOps already makes extensive use of meta-data. It is used to keep the test environment in sync with the operational, helps to track changes to the source code and so on. I’m NOT saying that DevOps doesn’t already use this meta-data, I am saying that it could do so much more with it. And to see how, all you have to do is to look at what is already regarded as normal in the machine learning world and apply that to DevOps.
For example, suppose we record a tiny bit more meta-data. Suppose, once a change has been deployed and has stood the test of time, we label it as ‘successful’ or ‘horror-show’. If we want more detail, we score it on a scale from 1 to 10. Either way, in machine learning terms we call this score the “Response”. The criteria we use in order to make that judgement of success may be simple or complex but, either way, assume we make it.
After a while we have a host of changes and for each we have a Response. Of course, for each of those changes we also have all of the associated meta-data – who suggested the change, who coded it, how long did it take to develop, who tested it, for how long, how many lines of code were changed, how many added and so on. In machine learning we call this data the “Predictors”. We create a table such that each row has the Predictors and the Response for one change. Then we pump that table into a supervised machine-learning algorithm. (Supervised machine learning algorithms determine which of the Predictors, if any, have an influence on the Response.) To give an example, we might use a Decision tree algorithm.
This would look at every Predictor and work out what was the single most important Predictor that leads to success or failure. This is not particularly complex to do (a great deal of machine learning is relatively simple), it just has to look at each Predictor in turn and see which one has the highest correlation with the Response. Let’s suppose that it eventually discovers a correlation between the Response and a Predictor which lists the day upon which the change is applied – changes applied on Sat. or Sun. go badly. Of the 1,086 changes we have applied, 61% (that is, 662 changes) were successful. 616 of those were applied at the weekend and only 44% (272) were successful. However, 470 were applied on a weekday and 83% (390) were successful.
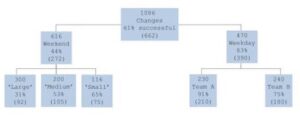
Once it has determined this correlation, the algorithm takes the set that were applied at the weekend and re-evaluates the rest of the Predictors to see which was the next most important one for this set. Then it does the same for the changes made on a weekday. As you can see from this (entirely fictitious) diagram of a decision tree, the next most important factor in each case is different. In other words, as we descend the tree, the splits at each level are completely independent of each other. Decision trees are wonderful for highlighting the factors that actually make a difference to a process and, once we have gained this knowledge we can start to try to work out why weekend deployments are less successful.
Analytics
Or take the cost vs gain. We look at each change and, before we start to implement it, we assign a value that we believe that change will yield. This is very hard. Sometimes a change will make us money, sometimes it stops us from losing money. But every change we make has SOME business justification for being scheduled and that usually can be assigned a monetary value. We also estimate the cost of that change. Once we have decided upon those two values, we start to implement and deploy the change and we also collect the costs of each change. Now, even without machine learning, this is likely to be standard practice – we usually want to know that a change is going to be worth making before we start. However, with machine learning we can also look for clusters of changes with similar characteristics. This is no longer asking “Is this particular change going to be worth making?” it is asking “Can we find changes that have similar cost/gain ratios?” and, if so, start to find out why.
Analytics is a broad church and is made up of a range of different techniques/algorithms. If we apply it to the meta-data that is already being collected and used in DevOps, we could expect to find out, for example, what is a reasonable number of lines of code to change in one update (and what number is dangerous), who is a good tester, how long is optimal to spend on an update, who is good to have on a project and who is torpedoing every good idea that comes along.
If I haven’t convinced you then I apologise for wasting the time it has taken you to read about 1,100 words. But, if you are even half convinced, give it a try. After all, you already have most of the data and the machine learning algorithms are free in R and/or Python. If it works you are a hero and if it doesn’t, no one need even know that you tried. You have nothing to lose by trying Data Driven DevOps.