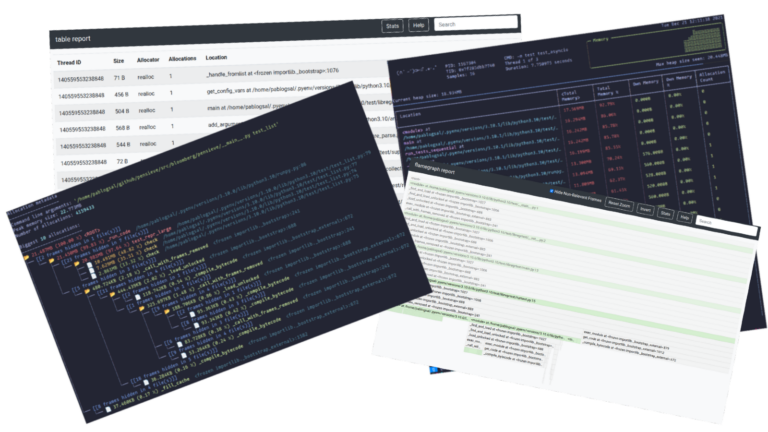
Memray is a memory profiler for Python that analyses both Python and native code
Interview: A new open source memory profiler for Python looks set for rapid adoption. “Until now you never could have such a deep insight in how your app allocates memory. The tool is a must for any long-running services implemented with Python,” said Python core developer Yury Selivanov on Twitter.
Memray comes from the team at financial software and services company Bloomberg, which has 3,000 Python coders, having shifted in recent years towards open source software including Python and R.
Python is a slow language, though, so there is still plenty of native code whether custom code written in C++, or libraries like Pandas and NumPy where performance critical code is written in C.
Pablo Galindo is a software engineer at Bloomberg, who also serves on the Python Steering Council and is release manager for Python 3.11, expected in October.
“Normally people don’t think that Python is good for things like real-time market data because we know that Python is not the fastest language by itself, but it doesn’t need to be. We tend to have a lot of C++ code running underneath and Python acts as the glue, orchestrating the thing,” he tells Dev Class.
Why create a new memory profiler? “There are a lot of Python profilers,” Galindo adds, “but the problem is that most of these profilers don’t know about this C++ layer. They know about Python but they either ignore the existence of C and C++, or the most specialized ones can see something going on but they cannot tell you how it is happening, they only tell you about Python.
“Developers at Bloomberg came to us and said: ‘We need to optimize. Now it’s very easy to have a program that consumes like 10GB of RAM and we need to understand where this is coming from and we cannot, because everything that exists right now ignores this thing or cannot show us what we need’.”
Why not just use a native code profiler rather than one for Python? “Then you have the reverse problem,” says Galindo. “You say to the profiler, ‘OK show me where I am.’ And it’s going to show you a bunch of C internals.
“If you are a person on the core team, you understand, because you know how Python is made – but for a Python developer that means nothing. What is my Python function? What is going on?”
A native profiler “doesn’t understand what’s going on in the VM, the VM being the Python interpreter (not a virtual machine in the normal sense),” says Galindo. “Python itself is like an abstraction, the only thing that runs is the compiled code and what people perceive as Python is just data in the C program that is the interpreter.”
Developing Memray was challenging, Galindo tells us, because “you’re bridging two difficult worlds and we also wanted some constraints, we wanted it to be fast, to be flexible, and to be very easy to use.”
Why is tracking memory so important for performance? “Most of the time memory and speed is two streams of the equation, normally you sacrifice memory to make the speed, caching is one example,” Galindo says. He is working with the Microsoft-sponsored faster CPython project, and notes that “one of the things we’re doing for 3.11 is making the interpreter faster but also it’s going to use a bit more memory, just a bit. Most optimizations have some kind of cost of memory.”
A problem, he says, is that developers who care about performance use more memory to solve the problem but may not understand the cost of allocating and freeing memory because “people treat them as a black box … allocating memory actually costs time.
“The other day we had a user who came to us with a big problem. ‘I’m doing this thing, it’s very slow, I’m using all the tools in the world, and I can’t understand what’s going on.’ We used Memray and we found out that they have a big cache, and they were just freeing it at some point, but in C++ in freeing the cache it needs to visit every single node so it’s actually traversing a tree and that is super slow, and they were doing [this] in a loop. They would never know, how is freeing that cache the slow operation? That was an example of how these things can be useful.”
Galindo also mentions a CPython memory leak issue that was fixed last year, noting at the time that “this could have been a nightmare to track down since the leak happens in very old code that is quite complex but funny enough, I tracked this super efficiently with the memory profiler that allows to track Python and C at the same time I am building at work with my team.”
There are a few points to note about Memray. It works well irrespective of the language used on the native side, whether C++ or Rust or other languages, Galindo says. It is also Linux only.
“This is the price of being fast and super low-level, you are binding a lot to the platform,” he adds. “There is a lot of linker knowledge and compiler knowledge and this is platform-specific. It is not architecture-specific so it runs on Arm64.”
That said, Windows users can use WSL (Windows Subsystem for Linux) and on macOS, Docker. “I develop Memray on a Mac. I use Docker,” Galindo reveals.
