
New Relic’s Change Tracking feature – now generally available – is intended to help DevOps engineers to answer the question, ‘what changed’, when confronted with an application failure or performance issue.
The idea is to mark observability reports with links to identify changes, such as deployments or infrastructure changes, to make it easier to trace the reason for issues revealed by the observability analytics. For example, in the APM (Application Performance Monitoring) section of the dashboard, DevOps engineers can see change markers overlaying the performance statistics. Each change marker links to a detail page where it is possible to drill down into before and after reports for items of interest such as the number of exceptions reported.
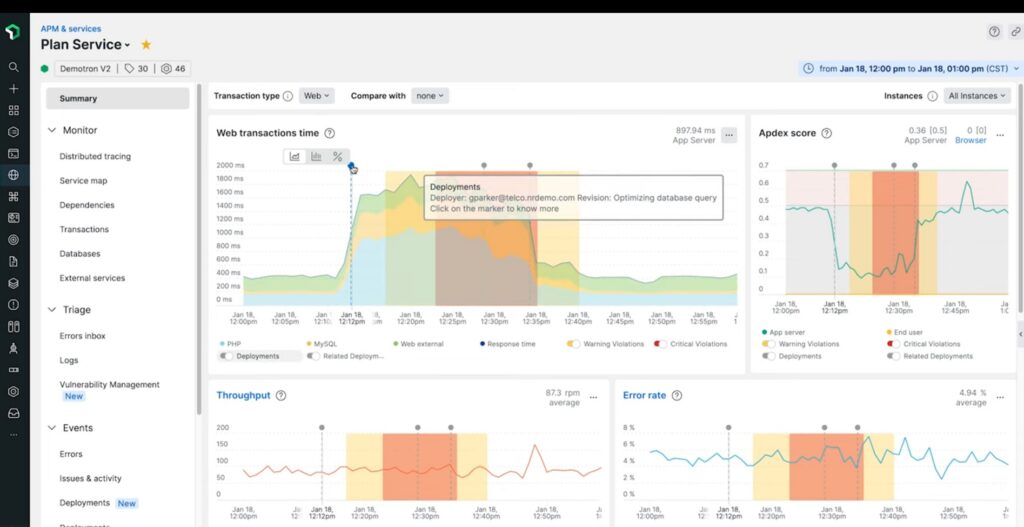
Another use case is to investigate whether an update achieved its goals. For example, if an update included what was thought to be a better-performing SQL query, did the actual query performance improve in the way that was hoped?
Changes do not have to be deployments or configuration changes, but could also be business or marketing events that might impact the application traffic, or stress particular components of the system.
In the majority of cases though, the insertion of change tracking markers will be automated as part of a CI/CD process. There are several ways to capture changes, including calling the NerdGraph API (the GraphQL API for querying New Relic data), or using the New Relic CLI (command-line interface), or via plug-ins for Jenkins and GitHub Actions. New Relic also references other CI/CD systems including CircleCI and JFrog, however, these are the only two plugins available currently according to the documentation. Another feature is integration with Slack via setting up a webhook.
Although New Relic said the feature is now generally available there are still limitations. “Our goal is to provide full-platform coverage for markers on charts, but some of the New Relic curated experiences don’t yet feature interactive markers on all charts. In the meantime, you can still record changes on relevant entity types and build your own experience around that type using a custom dashboard,” states the documentation. Another factor is that the newer GraphQL API is required for full features, versus an older REST API for recording deployments.